
Next:
Links
Contact:
Peter Mills
Previous:
...
libagf is a Peteysoft project
Isoline retrieval
 Contour advection
is a powerful method of modelling the evolution of a
contour or isoline of a trace substance as it is stirred by moving fluid.
Consider a blob of dye injected into a river or stream: to first order
it could be modelled by tracking only the motion of its outlines.
Even when advected by smooth or finitely-resolved velocity fields, these
contours often develop into intricate fractals, as shown in the above
animation. This is through a continuous process of stretching and folding,
which can be modelled to an arbitrary level of precision since new points
are added to or removed from the contour as it evolves in time.
Contour advection
is a powerful method of modelling the evolution of a
contour or isoline of a trace substance as it is stirred by moving fluid.
Consider a blob of dye injected into a river or stream: to first order
it could be modelled by tracking only the motion of its outlines.
Even when advected by smooth or finitely-resolved velocity fields, these
contours often develop into intricate fractals, as shown in the above
animation. This is through a continuous process of stretching and folding,
which can be modelled to an arbitrary level of precision since new points
are added to or removed from the contour as it evolves in time.Satellite instruments now make frequent, dense measurements of trace atmospheric constituents at global scale. They do not, however, measure the concentrations directly, rather they measure the intensity of radiation in a narrow beam. By understanding emission and absorption processes, underlying atmospheric variables may be retrieved by performing some sort of inversion. It is easy to show that a classification retrieval based on maximum likelihood is the most accurate method possible for validating an advected contour.
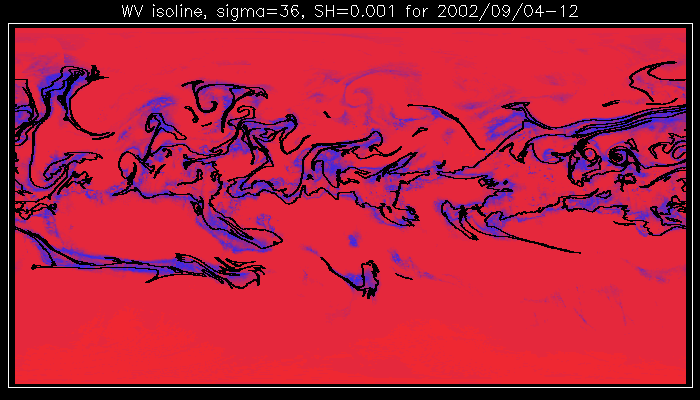
To test if the same fine scale structure as seen in the simulations exists in the real atmosphere, isolines of water vapour have been retrieved from high-resolution satellite data, as shown in the following figure.

The heavy black line represents an isoline retrieved from a selection of AMSU (Advanced Microwave Limb Sounder) channels, while the red line is from lower resolution ECMWF (European Centre for Medium-range Weather Forecasting) assimilation data, in other words, our current, "best guess." The shading indicates a 90% tolerance. Retrieved isolines show good agreement both with assimilation data and balloon measurements.
While the finest filaments from the contour advection models do not show up in the classification retrievals proper, they do show up in the conditional probabilities. In other words, there is a non-negligible probability (less than 50%) that the filament might be there. Although the horizontal resolution of the instrument is high (up to 15 km), the vertical resolution of retrieved data is limited by the small number of channels.


Land classification
Map of the waterways of the Northern Netherlands derived from a Landsat 7 image (click for the full-resolution image):

References
- Peter Mills (2009). Isoline retrieval: An optimal method for validation of advected contours. Computers & Geosciences, 35:2020-2031. doi: 10.1016/j.cageo.2008.12.015
- Peter Mills (2011) "Efficient statistical classification of satellite measurements." International Journal of Remote Sensing, 32 (21): 6109-6132. doi: 10.1080/01431161.2010.507795.